This is a step by step guide for executing and debugging native code on Android with Eclipse.
1. Prerequisites
The SDK version used for this guide is Froyo with the NDK r4b ( crystax release ).
Also Eclipse CDT plugin it’s very useful for our purposes, so install it.
Last plugin to install it’s the Sequoyah plugin for Eclipse.
2. Project setup
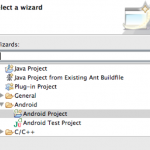
 At this point let’s create a new Android project, name it “Example” and use the “com.darkwavegames.com” package name, add also an Activity name of your choice.
Select Android 2.2 as base SDK version and complete the project wizard.
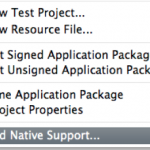
Now you need to add the native support for the newly created project. Just right click on the project root element in the package explorer and select “add native support”.
In the next dialog write the path of your NDK folder and give also name for your library.
After this operation a new folder “jni” will be created with a .cpp file, header filer and an Android makefile, Android.mk, which can be edited to modify all the includes, linker and compiler options. In the Android.mk file you also need to specify all the source file you want to use within the LOCAL_SRC_FILE directive.
3. Debug
In order to enable debug of native code in Android you have to face different problems, based also on the device and the firmware version, and if the native code is multi thread or single thread.
First of all you need to mofify the AndroidManifest.xml file adding the attribute “debuggable” to true ( remember also to enable the “Debug USB” option under the Application device menu ).
At this point you can debug all the java code within your eclipse debugger, for for the native C debug you need more steps.
3.1 Rooting
In case one of the below prerequisites are not available you need to root the device. For most of the device you just need to download from the market the application z4root.
3.2 PackageManagerService
The first thing needed in order to let the gdb-debug script works is the presence of the “com.android.server.PackageManagerServices” service on the device. This serve generates, for each installed application, a new entry inside the “/data/system/packages.list” file.
This file is used by the the “run-as” command to know the process privileges and its folder content.
If on your device this service is unavailable you need to create one.
( Just skip this step if you have the PackageManagerService on your device )
The file format is very simple. every line has 4 columns: package name, user id, debug flasg (“0” or “1”), applicatio folder.
You can do this: from Eclipse install the application just using the “Run as” command ( or via shell writing: adb install package.apk ). Now in a new terminal window write:
[cc]host:~ $ adb shell ps | grep com.darkwavegames.esempio[/cc]
First output entry will be the user associated with that process ( let’s say app_42 ). In order to obtain the user_id simply write:
[cc]host:~ $ adb shell su app_42[/cc]
Just copy the output ( which is the user_id, for instance 10042 ) and exit from shell ( using “exit” command).
Now we have to get the app folder. Unfortunately the /data/data folder is protected, so you need to log into the device and obtain root access.
[cc]host:~ $ adb shell su
# cd /data/data
# ls -l -h[/cc]
Look for the folder associated to our user ( in our example is: com.darkwavegames.esempio ).
Now we have all the informations for creating an entry for the packages.list:
[cc]host:~ $ adb shell su
# cd /data/system
# echo com.darkwavegames.esempio 10042 1 /data/data/com.darkwavegames.esempio > packages.list[/cc]
Now the run-as command will find all the required informations.
Note that in case you uninstall and reinstall the application you need to to repeat this steps because the system could have assigned a new user_id to that application.
Now you should be able to run the ndk-gdb script ( executing it inside the project folder ) and set breakpoints on the native code.
3.3 NDK-GDB
At this point starting ndk-gdb from the project folder should be enough. If you’ve verified all the above prerequisites and your code is simgle thread this should be enough.
Instead, if your native code is multi thread, the gdbserver which comes with the r4b can’t debug your code ( probably it has been compiled without the multi thread support ).
In this case you need to obtain from the android repository git://android.git.kernel.org/platform/prebuilt.git the “prebuilt” folder of the SDK. Now that you have download it into your $PREBUILT folder you need to download the gdbserver with multi thread support from this link.
Copy the gdbserver just downoaded into folder $ANDROID NDK PATH/build/prebuilt/$HOST ARCH/arm-eabi-4.4.0/bin where $HOST_ARCH is your developement architecture ( darwin-x86 if you’re with mac osx ).
Copy $PREBUILT/$HOST ARCH/toolchain/arm-eabi-4.4.0/bin/arm-eabi-gdb into $ANDROID NDK PATH/build/prebuilt/$HOST ARCH/arm-eabi-4.4.0/bin and use it as debugger.
We’re close to the goal!
Now modify the “install-binary.mk” script inside $ANDROID_NDK_PATH and change the line
[cc]$(call cmd-strip, $(PRIVATE_DST))[/cc]
into
[cc]ifneq ($(APP_OPTIM),debug)
$(call cmd-strip, $(PRIVATE_DST))
endif[/cc]
In this way, if in out Android.mk file there’s a directive APP_OPTIM with the value “debug”, the symbol strip will not be executed.
Now in order to have the debug running we need to add a breakpoint in the Java code just before the System.loadLibrary() method and start a new debug session from Eclipse.
As the code reach the breakpoint, open the terminal, enter the project folder and write these commands:
[cc]host:~ $ adb shell ps | grep com.darkwavegames.esempio app_42 4512 2377 648 332 c0318ffc afd0eafc S com.d…
host:~ $ adb shell
$ su
# cd /data/data/com.darkwavegames.esempio/lib
# ./gdbserver :5039 –attach 4512[/cc]
Without close terminal, open a new termina window and execute:
[cc]host:~ $ cd workspace/esempio
host:esempio $ adb forward tcp:5039 tcp:5039
host:esempio $ adb pull /system/bin/app_process \
obj/local/armeabi/app_process
host:esempio $ adb pull /system/lib/libc.so \
obj/local/armeabi/libc.so
host:esempio $ export NDK_BIN=$ANDROID_NDK_ROOT/build/prebuilt
host:esempio $ $NDK_BIN/darwin-x86/arm-eabi-4.4.0/bin/arm-eabi-gdb \ -x obj/local/armeabi/gdb.setup -e obj/local/armeabi/app_process[/cc]
gdb.setup is generated by the ndk-gdb, but is created into the libs/armeabi folder. It’s important to copy it into the “obj” folder and add the line “target remote :5039”.
Now from the gdb prompt it’s possible to add breakpoints and execute all the debug instructions such as step into, over, continue…
All these steps are included in the “remotegdb.sh” file, so you don’t need to write all these commands every time! Just execute this script in the project folder ( the same folder where the AndroidManifest.xml is located ).
Share with...