How-to debug native code with Android

This is a step by step guide for executing and debugging native code on Android with Eclipse.

1. Prerequisites

The SDK version used for this guide is Froyo with the NDK r4b ( crystax release ).
Also Eclipse CDT plugin it’s very useful for our purposes, so install it.
Last plugin to install it’s the Sequoyah plugin for Eclipse.

2. Project setup
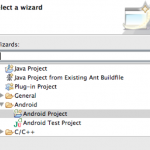
At this point let’s create a new Android project, name it “Example” and use the “com.darkwavegames.com” package name, add also an Activity name of your choice.
Select Android 2.2 as base SDK version and complete the project wizard.

Now you need to add the native support for the newly created project. Just right click on the project root element in the package explorer and select “add native support”.
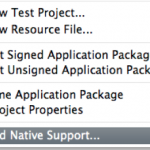
In the next dialog write the path of your NDK folder and give also name for your library.
After this operation a new folder “jni” will be created with a .cpp file, header filer and an Android makefile, Android.mk, which can be edited to modify all the includes, linker and compiler options. In the Android.mk file you also need to specify all the source file you want to use within the LOCAL_SRC_FILE directive.

3. Debug

In order to enable debug of native code in Android you have to face different problems, based also on the device and the firmware version, and if the native code is multi thread or single thread.
First of all you need to mofify the AndroidManifest.xml file adding the attribute “debuggable” to true ( remember also to enable the “Debug USB” option under the Application device menu ).
At this point you can debug all the java code within your eclipse debugger, for for the native C debug you need more steps.

Continue reading

FlashTracer for Firebug

FBTracer in action

Recently I decided to write my old flash tracer firefox extension from scratch because I found it not really useful (at least for me) and too “expensive”, moreover when using firebug at the same time.

So I made a quick test to see how much was hard to create a new panel inside firebug to display flash tracer.
This is the result of what I did right now. It does not have all the features of the old extension, it just display the flash traces. Anyway it is actually in early stage development, updates will come during next days.
Here the instructions and the download link (remrmber to install the flashplayer debugger and firebug first!):
P.S. It has been tested on osx snow leopard and windows 7 right now.

mm.cfg revealed!

I’ve just discovered an unbelievable post by Jean-Philippe Auclair with ALL the undocumented options of the mm.cfg file!

Really interesting in particular AS3Trace and AS3Verbose (and what is AS3Turbo anyway?). Also TraceOutputBuffered could be useful for all swf with uncommented trace calls 🙂

By the way, this is the list of features he discovered (follow the link above for detailed information on each command):
  • AllowUserLocalTrust
  • AS3AllocationTracking
  • AS3AutoStartSampling
  • AS3CSE
  • AS3DCE
  • AS3DynamicProfile
  • AS3MIR
  • AS3Sampling
  • AS3SSE
  • AS3StaticProfile
  • AS3Trace
  • AS3Turbo
  • AS3Verbose
  • AssetCacheSize=X
  • AutoUpdateDisable
  • AutoUpdateInterval
  • AutoUpdateVersionUrl
  • AVHardwareDisable
  • CodeSignLogFile
  • CodeSignRootCert
  • Convert8kAnd16kAudio
  • CrashLogEnable
  • DisableAVM1Loading
  • DisableDeviceFontEnumeration
  • DisableIncrementalGC
  • DisableMulticoreRenderer
  • DisableNetworkAndFilesystemInHostApp
  • DisableProductDownload
  • DisableSockets
  • DisplayGPUBlend
  • EnableIncrementalValidation
  • EnableLeakFile
  • EnableSocketsTo
  • EnableSocketsTo
  • EnableSocketsTo
  • EnforceLocalSecurityInActiveXHostApp
  • ErrorReportingEnable
  • FileDownloadDisable
  • FileUploadDisable
  • ForceGPUBlend
  • FrameProfilingEnable
  • FullScreenDisable
  • GCStats
  • GPULogOutputFileName
  • HeapProfilingAS3Enable
  • LegacyDomainMatching
  • LocalFileLegacyAction
  • LocalFileReadDisable
  • LocalStorageLimit
  • LogGPU
  • MaxWarnings
  • OverrideGPUValidation
  • OverrideUserInvokedActions
  • PolicyFileLog
  • PolicyFileLogAppend
  • PreloadSwf
  • PreloadSwf
  • ProductDisabled
  • ProductDownloadBaseUrl
  • ProfileFunctionEnable
  • ProfilingOutputDirectory
  • ProfilingOutputFileEnable
  • RendererProfilingEnable
  • RTMFPP2PDisable
  • RTMFPTURNProxy
  • ScriptStuckTimeout
  • SecurityDialogReportingEnable
  • SuppressDebuggerExceptionDialogs
  • ThirdPartyStorage
  • TraceOutputBuffered
  • TraceOutputFileEnable
  • TraceOutputFileName
  • UseBrokerProcess
  • WindowlessDisable

Add system excepthook in actionscript!

Imagine you’ve made a very huge flash application and many users will play with it every day.

Imagine they don’t have the flashplayer debug installed and at certain points they fall into undiscovered application bugs ( it’s impossible to have a real bug free application, we know this ).
Then, what happens? With the flashplayer debug installed you can see the traceback and you can also continue or dismiss the code execution. But without the debug player? The code will try to continue but probably at that point your application is broken and users will feel it more and more uncomfortable with it.
What I would like to have in flash, and probably you too, is a global system exception handling for those unhandled exception.
In this way you can both present the problem to your users and then also create a report system which will help you to improve and fix your own application!
Something like I did with SEPY years ago using the sys.excepthook of python:
When an exception is raised and uncaught, the interpreter calls sys.excepthook with three arguments, the exception class, exception instance, and a traceback object. In an interactive session this happens just before control is returned to the prompt; in a Python program this happens just before the program exits. The handling of such top-level exceptions can be customized by assigning another three-argument function to sys.excepthook.

My first Firefox extension! (FlashTracer)

Ok, it does nothing particular new, but it’s my first one 🙂

What it does?
If you have a flash debug player version you will see in the firefox sidebar all the swf trace output while running any of the swf in a browser window.
I have to say thanks to jayjam (Giuseppe Montemurro) who talks about the mm.cfg file yesterday at the From A to Web Adobe conference. I’d never read about this cool feature of the debug players.. and so I decided to make it as firefox extension.
I took 1 hour to make the XUL and js files, while the .xpi package was driving me crazy!.. the documentation is really terrible for my point of view.

Download and install FlashTracer from the Firefox extension page.

UPDATE: A new flash tracer called fbtracer has been released. This new extension is integrated into Firebug. Read more here

P.S. If you’re running the new 9,0,28 Flash plugin probably you noticed this extension wont work anymore. Adobe changed something and the plugin doesn’t read as previously the mm.cfg file so I’m invetigating on it. In the meanwhile you should tell the extension to point to this file: C:\Documents and Settings\{user}\Application Data\Macromedia\Flash Player\Logs\flashlog.txt.

For mac osx it should be: username:Library:Preferences:Macromedia:Flash Player:Logs:flashlog.txt

Using this path the flash tracer works again.

For discussing about this extension please use the forum instead of the comments here 🙂

Debugging PHP with XDebug

In these days, working with PHP after a lot of time, I’ve installed this cool tool for debugging PHP (it supports both PHP 4 and 5).
XDebug is really useful for debugging PHP, which is usually not really easy to debug, and also easy to install.
It provides a lot of valuable debug informations, for example a full traceback for errors, profilig with memory and CPU usage, profiling functions , etc..
I really suggest to take a look at it!
Both Windows and Linux versions are available for download
http://www.xdebug.org

NetConnection Debugger Alternates

Today I’ve started a new Flash project which will also involve Flash Remoting.
So I decided to try this ServiceCapture tools for debugging the amf messages as replacement of the builtin NetConnection debugger.
I’m really suck of the flash NetConnection Debugger (it works 50% of the times for me). Sometimes I need to close and re-open it in order to make it works again, sometimes it doesnt display anything at all…
Btw, ServiceCapture can capture every kind of HTTP traffic, not only remoting calls and it has also a bandwidth simulation feature. (and these are cool features)
However the full license costs $34.99, which is not so cheap for this kind of tool.
http://kevinlangdon.com/serviceCapture/

Xray ( The AdminTool ) becomes opensource

Many of us used Admin tool for debugging flash movies in the past, being a great debugging tool (for me much better than the one provided in flash).
Now Admin Tool is an opensource project!
What is Xray?
Xray (The AdminTool) is a “snapshot viewer” of the current state of your Flash application without impacting the performance or the file size of your application. Xray’s true nature is to look into the very guts of the Flash application and dissolve the 2d myth you see on screen to a 3D tangible entity you can truly crawl through.
The downloads provided with Xray are:

Other links:

More info available at: http://labs.blitzagency.com/?cat=2
http://www.osflash.org/doku.php?id=xray_the_admintool